

 Back
Back
















How to Calculate Fleet GPS Tracking ROI
Oct 15, 2026The return on a fleet tracking investment comes from five savings categories, and most of them start producing measurable numbers within the first quarter.
Definition: Fleet GPS tracking ROI measures whether the money a fleet gets back from its tracking system, across fuel, insurance, maintenance, labour, and theft recovery, outweighs what it costs to run the system each year, including the hardware purchase, the monthly subscription, and any installation fees.
Key Takeaways
- The cost side of fleet tracking has three components: hardware at roughly 50 to 300 per device as a one time purchase, a monthly subscription at 15 to 50 per vehicle per month depending on the feature tier, and installation, which is free for plug in OBD devices and 75 to 150 per vehicle for hardwired installs. [1]
- The savings side has five categories: fuel reduction (typically 10 to 15 percent of the fleet’s fuel spend), insurance premium discounts (5 to 15 percent upfront, 10 to 25 percent at renewal with data), maintenance cost reduction (10 to 15 percent through preventive scheduling), labour and overtime recovery (from eliminating unauthorised use and verifying time on site), and theft prevention or faster recovery.
- Payback on the tracking investment tends to fall somewhere in the 6 to 12 month range for most fleet operations. [2] Fuel savings and labour recovery appear within the first 30 to 60 days. Insurance savings appear at the next policy renewal. The maintenance number takes longer to show, usually 3 to 6 months, because preventive scheduling needs time to replace the old calendar or mileage habits.
- To put a number on it: a 10 vehicle fleet paying 30 per vehicle per month for a mid tier subscription spends about 3600 a year on software, plus 1000 to 3000 on hardware in year one. At an annual fuel bill of 80000, a 10 percent reduction returns 8000, and that single category already covers the full year’s tracking cost without touching the other four.
- The ROI numbers that vendors put in their proposals tend to assume the fleet will capture every possible saving at the highest published percentage. Most will not. The fleet that runs the calculation against its own actual spend figures, using the low end of each range, gets a number it can trust.
GPS tracking costs money, and the fleet owner considering it already knows that, because the subscription appears on the invoice every month and the hardware purchase appeared on the first one. The part that is harder to pin down is whether the savings it produces on the other side, fuel consumption going down, an insurance discount at renewal, fewer roadside breakdowns, drivers not running personal errands on the clock, actually add up to more than what the system costs. In most cases they do, and the break even point arrives sooner than the buyer was expecting, though that only holds if someone at the fleet is actually pulling up the reports and making operational changes based on what the data shows.
What follows is the cost side broken into its three layers, then each of the five savings categories with the ranges that show up in real fleet deployments, and then the full ROI formula worked out at three different fleet sizes so the reader can see how the maths lands in practice.
The cost side
Fleet tracking costs break into three layers. The hardware is usually a one time purchase. The subscription is ongoing. Installation may or may not be a factor depending on the device type.
Hardware
Three device types cover most of the market, and the price range depends on which one the fleet needs.
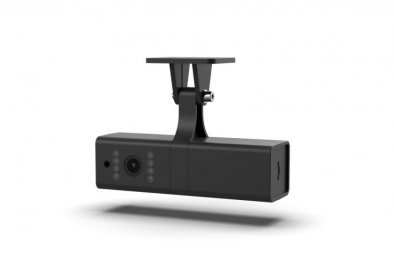
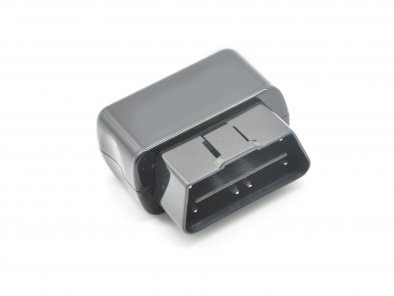
- OBD plug in devices: 50 to 150 per unit. Self install in seconds by plugging into the vehicle’s diagnostic port. No tools, no downtime, no installer. [1]
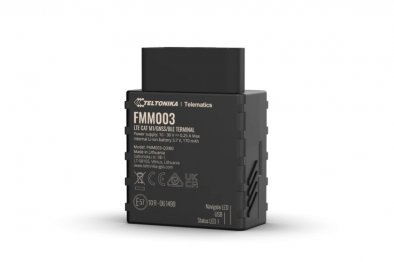
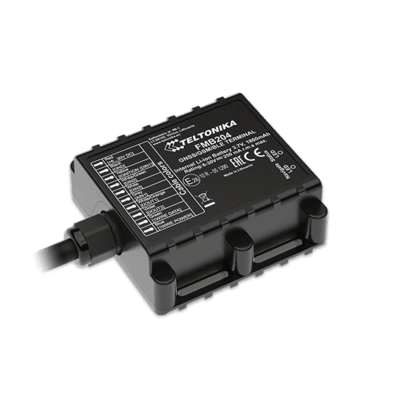
- Hardwired devices: 150 to 300 per unit. Wired into the vehicle’s 12V or 24V electrical system, hidden behind a panel. The installer’s time adds another 75 to 150 per vehicle on top of the hardware price. [1]
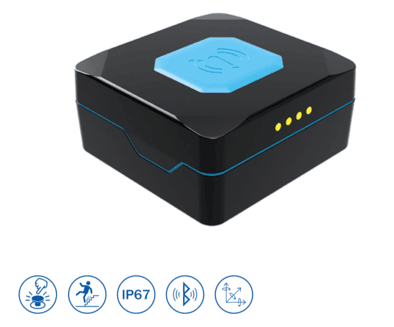
- Battery powered trackers: 100 to 250 per unit. Used on trailers, containers, and unpowered assets. No installation cost beyond the time it takes to mount the device.
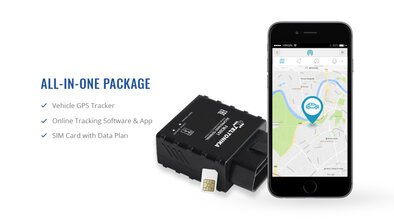
Some vendors bundle the hardware cost into the subscription, spreading it over the contract term. This reduces the upfront spend but increases the monthly cost per vehicle and usually comes with a contract lock in of 12 to 36 months. The alternative is buying the hardware outright and paying a lower monthly subscription with no contract term attached to it. Over two or three years, the total spend tends to land in a similar range either way, though the cash flow pattern is different, and the fleet that bought the hardware owns the devices at the end.
Subscription
What the fleet pays every month is the subscription, and that line item deserves more scrutiny during the vendor comparison than the hardware price does, because the hardware is a one time purchase that gets amortised across the life of the device while the subscription runs indefinitely. In 2026, the going rate across the market sits between 15 and 50 per vehicle per month for most fleet sizes and feature sets. [1]
- Basic tracking (location, trip history, geofencing): 15 to 25 per vehicle per month
- Mid tier (driver behaviour, fuel reporting, alerts, integrations): 25 to 45 per vehicle per month
- Advanced (AI dash cams, ELD compliance, predictive maintenance, dispatch): 40 to 60+ per vehicle per month
The per vehicle price typically drops with fleet size. A fleet with 5 vehicles usually pays somewhere near the list price. A fleet running 50 vehicles has room to negotiate a volume rate.
Installation
OBD plug in devices have zero installation cost. The fleet manager or the driver plugs them in. Hardwired devices require an installer, and the typical charge is 75 to 150 per vehicle. On a 20 vehicle fleet, that adds 1500 to 3000 to the first year cost, which matters for the payback calculation but does not recur.
| Cost component | Range per vehicle | Recurring? |
|---|---|---|
| OBD plug in hardware | 50 to 150 | One time |
| Hardwired hardware | 150 to 300 | One time |
| Battery tracker hardware | 100 to 250 | One time |
| Installation (hardwired) | 75 to 150 | One time |
| Monthly subscription | 15 to 50 | Monthly |
The savings side
The savings from fleet tracking come from five categories. Not every fleet will realise savings in all five, and the size of the saving in each category depends on the fleet’s operation, the baseline it is starting from, and whether the fleet actually acts on the data.
Fuel
Fuel is usually the category where the numbers show up first and where the total saving is largest. The three levers are idling, driver behaviour, and routing, and article 8 on this blog covers the fuel side in detail. The headline number from industry data is a 10 to 15 percent reduction in total fuel consumption once all three levers are addressed through coaching, policy changes, and routing adjustments. [3]
For a fleet spending 100000 per year on fuel, a 10 percent reduction is 10000 per year. A 15 percent reduction is 15000. The reason fuel tends to dominate the ROI calculation is that idle time reduction and speed compliance changes start producing visible results in the first few weeks once the coaching programme is running, which means the fleet sees money coming back before most of the other categories have had time to contribute.
Insurance
Insurers writing commercial auto policies have started offering premium reductions for fleets that install GPS tracking, and the size of the discount varies depending on the carrier, what kind of monitoring the fleet is running, and how much data it shares.
- Basic GPS tracking discount: 5 to 10 percent off the premium at installation. [4]
- Driver behaviour monitoring discount: 10 to 15 percent, available when the fleet shares behaviour data. [4]
- Performance based discount at renewal: 10 to 25 percent, based on 6 to 12 months of telematics data showing improved driver scores, fewer claims, and a documented coaching programme. [5]
For a fleet paying 50000 per year in commercial auto insurance, a 10 percent discount is 5000 per year. The discount does not appear immediately unless the carrier offers an upfront installation credit. Most of the insurance savings materialise at the next renewal, which is why fleets should install tracking and start collecting data well before their policy renewal date.
Example: A 25 vehicle service fleet paying 62000 per year in insurance installs telematics and starts a coaching programme. At the next renewal, the insurer reviews 10 months of data showing a 35 percent drop in harsh braking events and zero at fault claims during the period. The premium drops to 52000, a saving of 10000 per year, which alone covers the fleet’s entire tracking subscription cost.
Maintenance
Telematics feeds preventive maintenance through two channels that replace the old paper log and calendar reminder approach. The platform reads the vehicle’s odometer from the OBD port or CAN bus and fires a service alert when the fleet’s configured interval comes up. On top of that, diagnostic trouble codes from the engine control module surface problems while they are still cheap to fix, before they strand a vehicle somewhere and turn into a tow bill and a bigger repair.
The typical maintenance cost reduction from telematics based scheduling is 10 to 15 percent, driven primarily by the shift from reactive to preventive maintenance. [6] Reactive repairs cost significantly more than preventive service for the same component, because the failure often damages adjacent parts and the vehicle is out of service for longer.
Example: A 15 vehicle fleet spends 45000 per year on maintenance and repairs. After 6 months of telematics based preventive scheduling, unplanned breakdowns drop by half and total maintenance spend drops to 39000, a saving of 6000 per year.
Labour and overtime
GPS tracking reveals whether vehicles are where they are supposed to be, when they arrived, and how long they stayed. This data eliminates two common sources of labour waste.
- Unauthorised use. A vehicle that leaves the depot at 2 AM, or that takes a 30 minute detour to a non customer location during the working day, is visible on the trip history. The awareness effect alone, the fact that drivers know the trips are being recorded, reduces unauthorised use within the first week of deployment.
- Time on site verification. Geofence data replaces self reported timesheets with GPS verified arrival and departure timestamps. A service fleet that bills by time on site can verify every invoice against the platform data. A fleet that pays hourly drivers can confirm that the hours reported match the hours worked.
The labour saving is harder to quantify than fuel or insurance because it depends on how much waste existed before tracking was installed, and most fleets do not know the answer to that question until the data starts coming in. Fleets that discover a significant gap between reported and actual hours typically see the saving in the first pay cycle after the data becomes visible to management.
Theft prevention and recovery
A tracked vehicle that gets stolen is far more likely to be found and returned than an untracked one, and that single recovery event, depending on what the vehicle is worth and what it was carrying, can pay for the fleet’s entire tracking subscription several times over.
The saving here is binary. If no vehicle is stolen, the tracking system produced no theft recovery saving in that year, even though the deterrent value was present. If a vehicle is stolen and recovered because of the tracker, the saving is the replacement cost of the vehicle minus whatever damage occurred. For a fleet that operates in a high theft area or carries high value cargo, this category alone can justify the investment. For a fleet with a low theft history, it is a bonus rather than a primary justification.
The calculation
The ROI formula is straightforward.
The total annual cost includes the subscription (per vehicle per month × 12 × fleet size) plus the amortised hardware and installation cost. The total annual savings is the sum of whatever the fleet realises across the five categories.
Worked example: 10 vehicle fleet
A 10 vehicle service fleet installs OBD plug in trackers on a mid tier subscription.
| Cost side (year one) | |
|---|---|
| Hardware (10 × 100) | 1,000 |
| Subscription (10 × 30 × 12) | 3,600 |
| Installation (OBD plug in) | 0 |
| Total year one cost | 4,600 |
| Savings side (year one, conservative estimates) | |
|---|---|
| Fuel (80,000 spend × 10%) | 8,000 |
| Insurance (40,000 premium × 8%) | 3,200 |
| Maintenance (30,000 spend × 10%) | 3,000 |
| Labour (2 hrs/week × 25/hr × 52 weeks) | 2,600 |
| Theft (no event in year one) | 0 |
| Total year one savings | 16,800 |
In year two, the hardware cost drops out, so the annual spend falls to 3600 for the subscription alone. By that point, the coaching programme has had a full year to take hold, and the preventive maintenance schedule is catching problems earlier, so the savings side tends to stay flat or climb slightly.
Worked example: 30 vehicle fleet
| Cost side (year one) | |
|---|---|
| Hardware (30 × 200, hardwired) | 6,000 |
| Installation (30 × 100) | 3,000 |
| Subscription (30 × 25 × 12, volume discount) | 9,000 |
| Total year one cost | 18,000 |
| Savings side (year one) | |
|---|---|
| Fuel (300,000 spend × 12%) | 36,000 |
| Insurance (95,000 premium × 10%) | 9,500 |
| Maintenance (90,000 spend × 12%) | 10,800 |
| Labour | 5,000 |
| Theft | 0 |
| Total year one savings | 61,300 |
Worked example: 5 vehicle fleet
| Cost side (year one) | |
|---|---|
| Hardware (5 × 80, OBD plug in) | 400 |
| Subscription (5 × 35 × 12) | 2,100 |
| Total year one cost | 2,500 |
| Savings side (year one) | |
|---|---|
| Fuel (40,000 spend × 8%) | 3,200 |
| Insurance (18,000 premium × 5%) | 900 |
| Maintenance (15,000 spend × 8%) | 1,200 |
| Labour | 1,500 |
| Total year one savings | 6,800 |
Even the smallest fleet with the most conservative savings assumptions breaks even within the first five months, and the ROI is strongly positive by year end.
What to be sceptical about
ROI projections from tracking vendors tend to use best case savings percentages applied to average fleet spend figures. What comes out of that kind of calculation looks good in the sales deck but may not land anywhere close to what the fleet actually saves once the system is running.
Three things to watch for:
- Fuel savings percentages above 20 percent. The range that holds up across published studies and real fleet deployments is 10 to 15 percent. [3] A vendor projecting 25 or 30 percent fuel savings is either using an outlier case or counting savings from routing optimisation software that is sold separately from the tracking platform.
- Insurance discounts presented as guaranteed. The discount depends on the carrier, the fleet’s loss history, and whether the fleet actually runs a coaching programme. A fleet that installs tracking and does nothing with the data will not get a behaviour based discount at renewal.
- Labour savings are calculated from assumptions about waste the fleet has not measured. If the fleet does not know how much unauthorised use or time theft is occurring today, the vendor’s estimate of how much tracking will recover is a guess. The fleet should treat the labour line as a bonus that will be quantified after installation, not as a known input to the ROI calculation.
What produces a trustworthy number is taking the fleet’s own figures for fuel, insurance, maintenance, and labour, plugging in the low end of each published savings range rather than the midpoint or the high end, and seeing whether the result still covers the annual tracking cost. If the maths works at 10 percent fuel savings rather than 15, the investment is on solid ground. If it only works at the high end of every category, the decision comes down to how confident the fleet is that it will follow through on the coaching and maintenance programmes that produce those higher numbers.
Example: A fleet owner runs the ROI calculation using the vendor’s projected 20 percent fuel saving and gets a 4 month payback. The same calculation at 10 percent fuel saving gives a 7 month payback. Both are positive, but the 7 month figure is the one to plan around because it does not require the best case scenario to hold.
5 ROI calculation mistakes that mislead the decision
1. Leaving the hardware cost out of year one
The subscription fee is the number that shows up every month, so it is the one most buyers focus on. But year one also includes the hardware purchase and, for hardwired devices, the installation fee. A payback period that only counts the subscription will come out shorter than it should.
2. Including savings the fleet is not going to pursue
A tracking system that gets installed and then ignored will deter theft, and that is about it. The fuel savings require a coaching programme. The insurance discount requires sharing data and documenting the coaching. The maintenance savings require someone to configure the alerts and act on the codes. Any line the fleet does not plan to actively pursue should sit at zero in the projection rather than carrying a percentage it will never capture.
3. Substituting published averages for the fleet’s own spend data
When a vendor says “the average fleet saves 12 percent on fuel” the study behind that number is probably real, but the fleet across the table has its own fuel bill, its own routing patterns, and its own baseline. A fleet that already runs tight routes and has coached its drivers for years is not going to see the same percentage drop as one that has never opened an idling report.
4. Booking the insurance discount from month one
The premium does not change the week the trackers go in. The reduction lands at the next policy renewal, and depending on where the fleet is in its policy cycle, that could be three months away or twelve. The year one ROI calculation should count the insurance savings only from the actual renewal date forward, not across all twelve months.
5. Treating the year one number as permanent
Year two costs less than year one because the hardware purchase and the installation fee are gone and only the subscription remains. Year two may also save more, because the coaching programme and the maintenance schedule have had twelve months to take hold. Revisiting the calculation after the first full year gives the fleet an updated picture that is usually better than the original projection on both sides.
Frequently asked questions
How long does it take for GPS fleet tracking to pay for itself?
Somewhere between 6 and 12 months is the range most fleets land in. [2] Fleets that have a high fuel bill or discover a large gap between reported and actual working hours sometimes clear the break even point inside the first quarter. The speed depends on how large the fleet is, what the per vehicle subscription costs, and whether someone starts pulling reports and acting on the data right away or lets the first few months pass before building the coaching and maintenance routines.
What is the biggest savings category for most fleets?
Fuel, which usually accounts for somewhere around 40 to 60 percent of the total return. The reason it dominates is that fuel is the largest variable operating cost in most fleet budgets, and the three things tracking makes visible, idle time, speed compliance, and routing, all start cutting consumption within weeks of the coaching programme going live.
Does fleet size affect the ROI percentage?
Not by much, because the cost per vehicle and the savings per vehicle tend to move together as fleet size changes. A 50 vehicle fleet generates a bigger total saving in absolute terms than a 5 vehicle fleet does, but when you divide each fleet’s savings by its tracking cost, the percentage comes out in a similar range.
Can I get an insurance discount just for installing GPS tracking?
Some carriers apply a 5 to 10 percent reduction to the premium as soon as the tracking hardware is installed and verified. [4] The bigger discounts, in the 10 to 25 percent range, come at the next renewal after the insurer has had 6 to 12 months of driving data and claims history to review. The fleet should contact its insurer or broker before installation to confirm what discount programme is available.
What if my fleet already has low fuel waste and good driver behaviour?
The fuel and behaviour categories will produce a smaller percentage saving in that case, but the remaining three categories, maintenance, insurance, and labour, can still add up. A well run fleet tends to get its return from the preventive maintenance alerts, the GPS verified time on site records, and the documented driving history that the insurer weighs at renewal, rather than from the fuel coaching side.
The Bottom Line
Fleet GPS tracking pays for itself in months, not years, and the calculation is not a complicated one. The fleet adds up what it spends on tracking each year, adds up what it saves across the five categories, and compares the two numbers. For the large majority of fleets, the savings number is the bigger one, and the gap between the two gets wider in year two once the hardware cost drops out and the coaching and maintenance programmes have had time to mature.
GPSWOX tracking subscriptions provide the location, behaviour, fuel, and maintenance data that feed each line of the ROI calculation, with per vehicle pricing that adjusts to fleet size.
Article Sources
- Tech.co. “Best Fleet Management Software 2026.” https://tech.co/fleet-management/fleet-management-software
- Heavy Duty Journal. “Fleet Telematics ROI: Complete Guide to GPS Tracking Returns.” https://heavydutyjournal.com/fleet-telematics-roi-calculator-measuring-real-returns-from-gps-and-vehicle-monitoring-systems/
- U.S. Department of Energy. “Driving More Efficiently.” https://www.energy.gov/energysaver/driving-more-efficiently
- My Money Comparison. “Fleet Trackers & Telematics: How They Reduce Insurance Costs.” https://www.mymoneycomparison.com/fleet-trackers-telematics-how-they-reduce-insurance-costs/
- Alliance Fleet Solutions. “Using Telematics Data to Lower Insurance Premiums: A 2026 Fleet Strategy.” https://alliancefleetsolutions.com/2026/05/31/using-telematics-data-to-lower-insurance-premiums-a-2026-fleet-strategy/
- Expert Market. “Fleet Management Costs — In-Depth Guide.” https://www.expertmarket.com/fleet-management/costs